← Changelog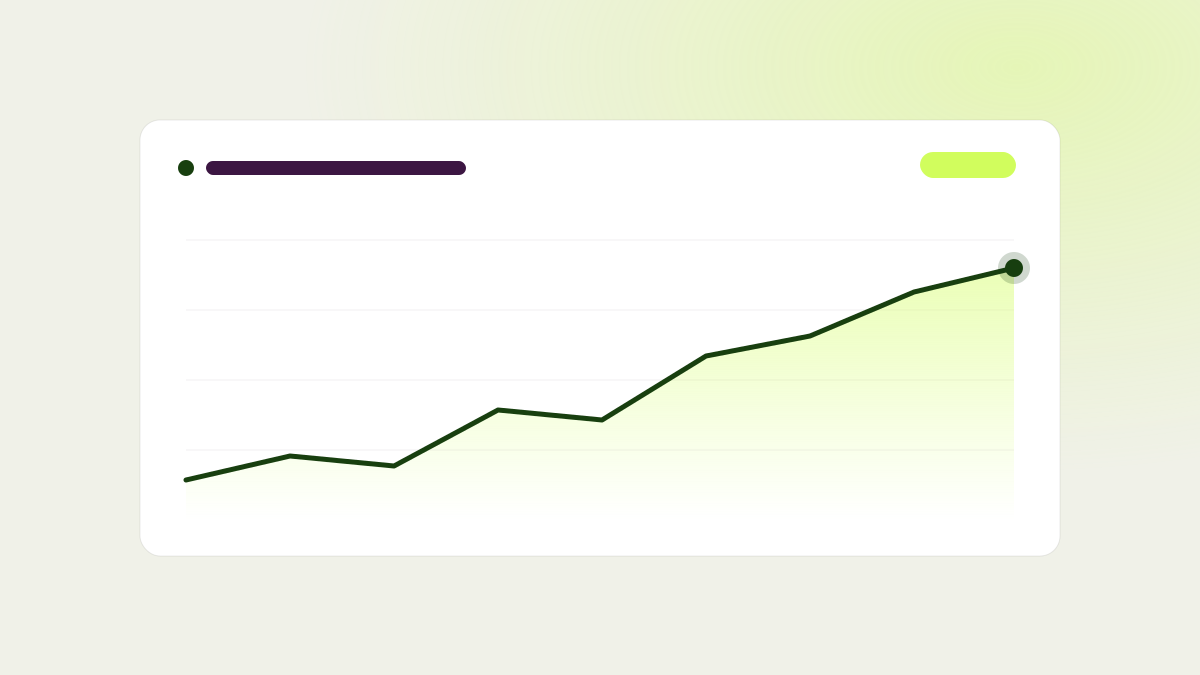
ImprovementMay 18, 2026
Daily Views in Test Charts
Knowing that a test is accruing data as expected should not require digging through raw numbers. Test charts now show daily views and daily unique visitors over time, so you can see traffic patterns at a glance.
This makes it much easier to spot a sudden dip in traffic, confirm that a test is picking up the volume it needs, or simply understand how visitor behavior is trending day to day.
The metrics dashboard also gained cumulative charts, giving you a clearer view of totals building up over the life of a test, not just the daily snapshot.
- Daily views and unique visitors on test charts
- Cumulative charts on the metrics dashboard
- Easier to spot traffic dips or data collection issues early